Oracle Integration Cloud (OIC) - Integration Activation

 Activate an Integration

Once you create an integration and the progress indicator shows 100 percent, you can activate that integration to the runtime environment. An integration shows as 100% and is eligible for activation after you have specified the source connection, the target connection, the data mappings, and the tracking fields.

To activate an integration:

Note: 

If you activate a new version of an existing integration, tracking instances or logs of the old version are not deleted. However, related artifacts are deleted and redeployment is performed on the back end. Monitoring data is also removed.
  1. In the left navigation pane, click Home > Integrations > Integrations.
  2. Go to the row of the integration to activate.
  3. Click the Activate icon icon to activate the integration.
    The Confirmation dialog is displayed.
  4. Select options appropriate to your integration.
    ElementDescription

    Contribute integration mappings to Oracle Recommendations

    Click to enable the Oracle Recommendations Engine.

    Uses the collective intelligence to recommend which fields should be mapped while developing an integration. These recommendations are built based on the mappings contributed to Oracle Recommendations Engine anonymously. You can change this on the Recommendations page by selecting Settings > Recommendations in the navigation pane.

    Enable Asserter Recording

    Click to capture payloads and record instances for playing back and testing,

    Enable tracing

    Click to enable detailed tracing information in the activity stream.

    When this checkbox is selected, detailed logging information about messages processed by this integration flow at runtime is collected. This can aid in troubleshooting issues. However, detailed tracing may also impact performance. To disable tracing, you must deactivate the integration, then reactivate it without selecting the Enable tracing checkbox.

    If you do not enable tracing, minimal logging details are created in ics-flow.log to indicate when the activated integration begins and completes execution (regardless of execution success or failure). You can download the logs on the Dashboard page.

    If you want to enable payload tracing to log input and output payloads to the activity stream, click the Include payload checkbox.

    When this checkbox is selected, information from the payload is also written to the log files, which can be downloaded and viewed. For example, you see more detailed logging information about payload activity at several points in the integration flow, such as the payload prior to data mapping and the payload after data mapping. This action can present a security risk and also impact the performance of your system. This setting is not recommended for a production environment.

  5. Select an activation option. The options available are based on the type of integration you are activating:
    1. Click Activate (if you are activating a nonscheduled integration).
    2. Click Activate and Schedule (if you are activating a scheduled integration).
      The Run integration_name page is displayed. Create a schedule for running this integration, and click Save
    A status message is displayed in the banner at the top of the page. For example:
    Description of integration_activation.png follows
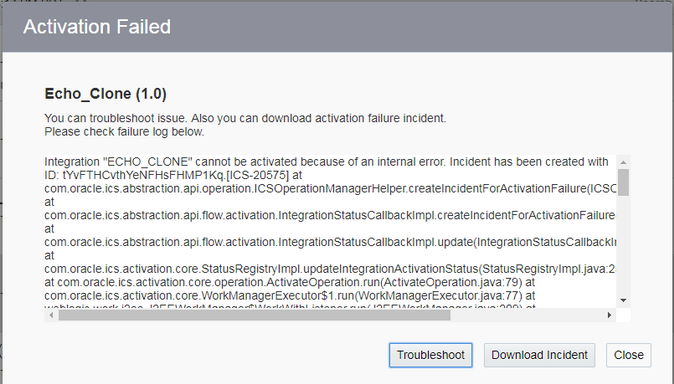
  6. If integration is unsuccessful, an Activation Failed warning icon is displayed in the banner. If you click the icon, a dialog is displayed with the option to download details about the activation failure incident.
    Description of integration_active_fail.png follows
    1. If your integration includes a function that is not completely configured, an error message is displayed in the banner. You must complete configuration of this function before you can activate the integration. Click inside the integration and note the following errors/warnings:
      • An error icon is displayed on the function call action that uses the incomplete function. The Error panel on the right side of the integration canvas provides specific details about the incomplete function.

      • A warning icon is displayed on the mapper that uses the inputs and outputs of this function. After completing function configuration, you must verify the input and output mappings before activating the integration.

    If activation is successful, the status of the integration changes to ACTIVE in the row.
  7. Click the How to Run link icon to display details about how to run, test, and track instances for this integration.
    For example:Endpoint URL and How to run, Test, and Track Instances links.

    If you selected to enable tracing, the words TRACE ENABLED are displayed under the icon you clicked to activate the integration. If you click the integration instance on the Track Instances page, the hamburger menu menu includes an option called View Activity Stream for viewing payload details.

    To access the detailed trace logging information:

    1. In the left navigation pane, click Home > Monitoring > Integrations > Dashboards.

    2. Click Download Diagnostic Logs to download Oracle Integration logs and diagnostics logs.

  8. View active integrations by clicking the integration name or selecting View from the Actions menu menu. The active integration is displayed with a message saying View Only in the banner at the top.
Note the following details about read-only mode:
  • No Save button is displayed.

  • There are no InvokesActions, or Errors icons.

  • You can click through multiple parts of the integration to view configuration details, such viewing the business identifiers under the Tracking link, viewing the source-to-target and target-to-source mappings in the mapper, and viewing the configurations on the pages of the connection wizards, but you cannot modify anything.